Those who trade options or write covered calls should be familiar with how the different option-related strategies win and lose. Investors and traders alike should be able to interpret these graphs, which can add greatly to understanding of how each strategy works.
Profit and loss graphs for options show the result at expiration, when all time value is gone. Prior to expiration, other factors affect the amount of profit or loss on closing the position, such as delta (how much the option’s price moves in response to price changes in the underlying stock) and implied volatility (the amount of potential future price volatility in the underlying stock that has been priced into the option). Our first illustration, Figure 3.6, shows how the classic profit and loss graph works:
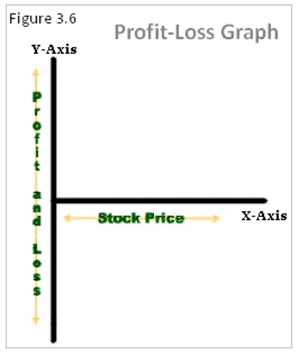
The vertical Y-axis (Profit and Loss on the trade) reflects the amount of profit or loss that results from a movement in stock price. The horizontal X-axis (Stock Price) presents a range of possible stock prices, such as $35 to $45, although any prices could be used. The stock prices and profit and loss amounts should be appropriate to the trade, of course.
If an investment involved an $80 stock, for example, we would use a stock price range of $75 to $85. $1 increments frequently are used, but could be $5 or any amount.
The graph illustrates the interaction of stock prices and the profit/loss amounts, and it shows at a glance how much, and how, a given position gains or loses in value as the stock price changes.
Long Stock
Let’s begin with the easiest graph to understand: long stock. When you buy stock, you lose or make money depending on whether the stock moves up or down, or remains where it is. If it does up $1, you are ahead exactly $1 (less commissions). While this is obvious, a graph illustrates the dynamic clearly.
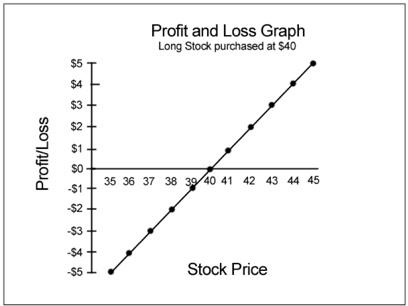
Figure 3.7
The Figure 3.7 graph below we bought the stock at $40 and appropriately crosses the $0 line at the $40 stock price. If the stock remains at $40 (breakeven), we see that there is $0 profit or loss. A fall to $38 results in a $2 loss, and a rise to $45 dollars results in a $5 profit, assuming in either event that we sell the stock.
If we do not sell when the stock moves, the position is impaired or improved to the extent of the movement. The maximum loss is of course the $40 paid for the stock, plus commission costs.
The maximum possible gain is unlimited, at least theoretically. The graph could be drawn to show the profit and loss possibilities for all stock prices from $0 through any price imaginable, but would be rather unwieldy. For our purposes, the graph adequately illustrates what happens when the stock moves by a given amount.
The same computations could be laid out in table or spreadsheet form, but the graph actually gives a more complete, and dynamic, picture of what happens when the stock moves.
We will now take a look at some basic option positions. Profit and loss graphs can involve stock only, stock plus various long and/or short options, and different options with no stock. On any profit and loss graph involving options, the graph line will bend up or down, or flatten out, at each option strike price that comprises part of the position. Therefore the graph line should change (rise, fall or flatten) whenever another option strike comes into play.
Long Call
Let’s look now at another simple position: a long call. We simply buy call options. Since the long call is a surrogate for owning the stock, its value generally improves when the stock goes up, and deteriorates when the stock goes down: a bullish position. Assuming we purchase the 40 Call at a $3 cost, that $3 is the maximum amount (plus commissions) that can be lost. We can see clearly in the Figure 3.8 graph below how the position will behave:
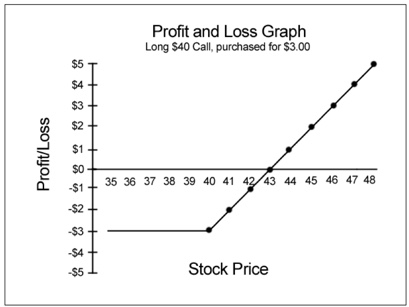
Figure 3.8
The position line bends up at the $40 strike price, forming a line that looks like a hockey stick. Had we simply bought the stock at $40, the breakeven would of course have been the $40 price.
But paying $3 for the 40 Call moved the breakeven to the $43 stock price ($40 strike + $3 call premium). The graph shows us that breakeven ($0 gain or loss) occurs at a stock price of $43, where the position line crosses the breakeven line.
We also see that the maximum possible loss is realized at a $40 stock price.
That is, no matter how low the stock price falls below that, the maximum loss remains $3, illustrated by the flat line at the -$3 amount on the Profit/Loss axis. If the stock is $43 at expiration, the 40 Call will be worth precisely $3; no gain or loss on the position. If the stock is $47 at expiration, for example, the call will be worth $7, which is a$4 gain on the trade, as the graph shows ($47 stock price – $40 strike – $3 put cost) by the dot where the $47 stock price and $4 gain intersect.
Long Put
What if we buy a put instead of a call? The long put is a surrogate for how to short stock, so its value generally increases when the stock falls, and decreases when the stock rises; it is a bearish trade. Assume that we purchase the 40 Put at a cost of $2: as we will see, that is the maximum amount (beside trade commissions) that can be lost.
The graphed position line bends upward at the $40 strike price. If we had shorted the stock at $40, that price would have been the breakeven. But paying $2 for the 40 Put moved the breakeven to the $38 stock price ($40 strike – $2 call premium), as illustrated. The graph shows us that breakeven ($0 gain or loss) occurs at a stock price of $38, where the position line crosses the zero line. In other words, if the stock is $38 at expiration, the long 40 Put will be worth exactly $2, in which case we will have no gain or loss on the trade.
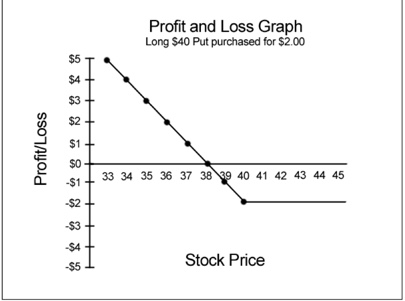
Figure 3.9
If at expiration the stock is $34 at expiration, the 40 Put will be worth precisely $4 ($40 strike – $34 – $2 cost). We can see this on the graph, since the position line at the $4 profit level is precisely at $34.
We also see that the maximum possible loss is realized at a $40 stock price. No matter how high the stock price rises above $40, the maximum loss remains $2, which is why the position line is flat at the -$2 amount on the Profit/Loss axis.
The graph also shows that if the stock is $39 at expiration, the 40 Put will be worth $1, for a $1 loss. It makes clear that the long put will gain in value dollar-for-dollar (at expiration) as the stock falls below the $38 price level.
And so on. If the stock is $23 at expiration, we know the 40 Put will be worth $15. How? Looking at the graph, we see that the put is worth $5 if the stock is $33. If the stock is down a further $10 to $23, simply add $10 to the put’s value. The long put is just the opposite of a long call, and the shape of the position line on each graph makes this point eloquently.
>> Note a Long Call and a Long Put together combine to form a straddle options strategy.
Short Call
The short call (naked call) is a neutral-to-bearish trade that makes the maximum profit if the stock falls or at least stays below the call strike. Unlike a long option, which costs money to put on, we pocket a credit for selling naked options. What can we expect if we wrote the 40 Call naked for a $3 premium?
Figure 3.10
The maximum profit in the trade is the $3 in premium received. The stock need not fall in order to realize the maximum profit; since the call was written ATM when the stock was $40, we only need for the stock to stay at or below the $40 strike.
At any stock price above $40 at expiration, the short 40 Call will be exercised and that exercise will be assigned to us. Therefore any stock price above $40 at expiration eats into our profit, and at $43, the profit is gone to zero.
The position line bends down at the $40 strike price. The short call’s breakeven point at expiration is $43 (40 stock price + 3.00 premium); if the stock is $43 at expiration the put will be worth exactly $0. For this reason, the position crosses the $0 (breakeven) line at the $43 strike price.
Assume that the stock rises to $45 at expiration and we buy it at that price to cover the stock delivery obligation. Since we pay $45 for the stock but sell it at $40 when assigned (we also received the $3 premium, remember), the loss will be $2 per share ($45 – $40 – $3). Appropriately, the position line is exactly at the -$2 point for a $45 stock price.
The problem with the short call is that the maximum loss is – theoretically – unlimited. The graphed line also shows this, because the higher the stock price, the greater the loss. If assigned an exercise in the stock, which will happen if the stock is over $40 at expiration, the naked call writer must go into the market and buy the stock in order to deliver it upon assignment. If the stock should, for example, gap up to $90 (it happens) – the naked writer could be looking at a huge loss.
What to do? Obviously, a prudent naked call writer would, upon seeing the stock rise above the $40 strike price, take one of a number of protective actions, such as: 1) close the position by repurchasing the short calls, which would result in a small profit or loss, 2) buy the stock, which both locks in the stock price and ensures that the delivery obligation upon assignment is covered, or 3) buy a higher-strike call (e.g., $45 or $50 strike) to create a bear call spread, which also ensures that the stock can be purchased at a known price for delivery and limits the loss to the amount of the net spread, which is the total spread less the net credit received.
More profit and loss graphs will be featured in subsequent chapters to illustrate various strategies discussed.

The author has no position in any of the stocks mentioned. Financhill has a disclosure policy. This post may contain affiliate links or links from our sponsors.