Most people would claim the future is unpredictable, but is it really? Sometimes patterns emerge in stock markets that illuminate a seasonality. This is especially true when patterns emerge over years, decades or even centuries. It’s one thing to spot a share price hitting support or resistance from one week or month to the next, it’s quite another to spot a pattern that emerges over decades – these are easily glossed over by casual traders.
Seasonal stock charts are especially valuable in spotting when markets have a tendency to fall, or worse, crash. Although more often than not, markets climb a wall of worry higher, the times when a stock market crash is on the verge of manifesting, you want to be long gone from the market, or at the very least have some serious hedging in place in the form of put options.
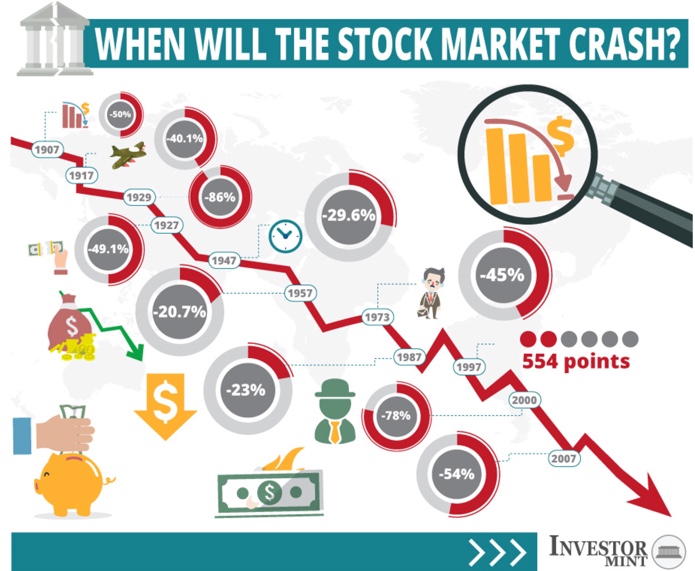
But how do you spot these multi-decade seasonal trends? We can see from the chart below that stock market seasonality is not confined to weekly or monthly or even yearly patterns, but can emerge over decades and centuries.
Source: Investormint
A curious pattern in history rhymes even if it doesn’t repeat with absolute precision – years ending in 7 are more often likely to lead to stock market crashes than other years. Plus, a stock market crash is more likely to take place in the month of October than most other months.
The years ending in 7 when a stock market crash occurred included 1907, 1917, 1937, 1947, 1957, 1987, 1997, and 2007. So, when will the stock market crash?
Will the stock market crash in 2017 and 2027?
Nobody can know for sure, but the seasonality of stocks doesn’t stop there. Some of the worst performances in stock market history took place in October.
In 1907, 1929, 1957, 1966, 1987, 1997, and 2007 October was a horrific month in the stock market. Is it a coincidence that so many years ending in 7 the stock market crashed and that in so many of these years October was the worst month for the stock market?
Some might call exiting the market in October of years ending in 7 superstitious, but when history shows more than a random pattern of stock market crashes, it is at the very least worth paying heed, and perhaps even hedging via bear puts or other options trading strategies.
Absent an options trading strategy, another way to bet on a stock market crash is to short stock or short the market in general.
Short selling involves borrowing from your broker and selling stock, which you promise at some point in the future to hand back. The cost of borrowing the stock is to pay margin interest, which usually is charged at a high premium above the risk-free Treasury bill rate.
If the stock market doesn’t fall, you will have to pay your broker the cost of margin interest. And if the position goes against expectations, and the market rises, you will need to buy back at a higher cost, and lose money as well as paying margin interest.
So before shorting stock or shorting the market, you need to be very confident the downside opportunity is compelling, probable, and leads to a big win. And you need to make sure you can handle the risk if the market goes in the wrong direction.
>> What Are Naked Puts And Calls?
#1 Stock For The Next 7 Days
When Financhill publishes its #1 stock, listen up. After all, the #1 stock is the cream of the crop, even when markets crash.
Financhill just revealed its top stock for investors right now... so there's no better time to claim your slice of the pie.
See The #1 Stock Now >>The author has no position in any of the stocks mentioned. Financhill has a disclosure policy. This post may contain affiliate links or links from our sponsors.