Ichimoku cloud is a type of technical analysis method that is often simply called Ichimoku. It is based on Japanese candlestick charting to predict future price movements.
Only in the 1960s did Ichimoku came to the attention of the public when a Japanese journalist named Ichimoku Sanjin, also known as Goichi Hosoda, released it publicly after three decades perfecting it.
The idea behind the Ichimoku Cloud Strategy is to use a moving-average based trend method to indicate where a stock is likely headed next.
In addition to price action, Ichimoku uses time as another element, and because greater data points are used, it is generally regarded as providing a clearer picture than Japanese Candlesticks.
How The Ichimoku Cloud Strategy Works
Ichimoku cloud is designed to spot direction and momentum in order to help you make buy and sell decisions more easily.
Five indicators are used with each corresponding to a different timeline.
Ichimoku Cloud
The cloud is known as the Kumo and is what grabs your attention right away because it’s the most noteworthy of the five indicators.
When prices are above the cloud, the trend is positive. And when prices fall below the cloud, the trend is negative.
When the price action takes place within the cloud, it is believed that the trend is flat.
But how do you know when the trend is strong?
Leading Span A Line
The next indicator or line to pay close attention to is the Leading Span A, which is also known as Senkou Span A.
When share prices rise above the Leading Span A, the top line acts as support while the lower line acts as a second support level.

Leading Span B Line
On the other edge of the Kumo or cloud is the Leading Span B line, which is called the Senkou Span B.
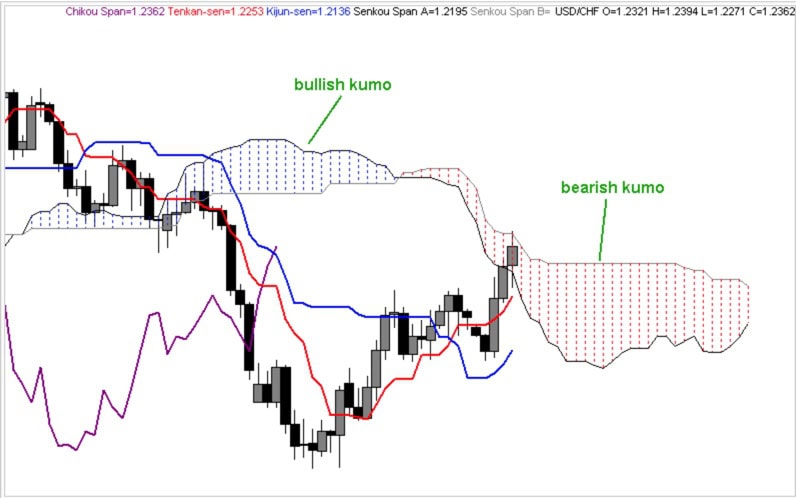
When the Leading Span A line rises above the Leading Span B line, the uptrend is strong. On technical charts, this produces a green cloud.
Conversely, when the Span A line falls below the Span B line, the downtrend is strong. Generally, this is represented by a red cloud.
But how can you use Leading Span A and Leading Span B lines to identify resistance and support?
How To Spot Resistance and Support
The way the Leading Span A & B lines are constructed means the the clouds which form are plotted 26 days ahead of the most recent price action.
So, you can quickly identify where future resistance and future support will likely be.

Source: KumoTrader
How To Use The Ichimoku Cloud Indicator
The cloud is defined the region between the Leading Span A and B lines, otherwise known as s the Senkou Span A and B lines.
Both current support and resistance lines as well as potential future support and resistance lines are identified by cloud edges.
When prices change, the cloud or Kumo changed height and shape, which in turn affects support and resistance levels.
Large price movements form thicker clouds, creating stronger resistance and support levels while the cloud height signifies to the extent of price volatility.
When the clouds are thin, support and resistance levels are viewed as being weak. At times like these, it is believed that prices can pierce through those levels more easily.
Bullish Indicator
The bottom line is when the Senkou Span A or Leading Span A line rises above the Senkou Span B or Leading Span B line, the trend is bullish.
Bearish Indicator
And when the Senkou Span A or Leading Span A line falls below the Senkou Span B or Leading Span B line, the trend is bearish.
Source: KumoTrader
Trend Reversals
When the Senkou Span A and B lines switch positions, leading to Ichimoku cloud twists, trend reversals may be seen.
Ichimoku Cloud Explained: How To Identify Strong Trends
The angle of the cloud can be used to gauge the strength of the trend.
When the cloud is rising upwards at a steep angle, a strong bullish trend is generally evident.
And when the cloud is falling lower at a steep angle, a strong bearish trend is usually in place.
Sometimes, clouds will form behind the price action and these are known as Kumo shadows.
Buy & Sell Signals
A buy signal forms when the green line, known as the Chikou line, rises from below the price action to cross above it.
A sell signal forms when the Chikou line (green line) crosses below the price action.
Five Lines Of Ichimoku
Ichimoku comprises five lines:
- The Tenkan Sen
- The Kijun Sen
- The Chikou Span
- The Senkou Span A
- The Senkou Span B
We’ve already seen a few of these but let’s take a look at the others.
Tenkan Sen
The Tenkan Sen is a measure of the average of a price’s highest high and lowest low for the previous 9 periods.
It is not a simple moving average over the prior 9 periods as some contend.
The philosophy behind the Tenkan Sen measurement is that the average of closing prices over a period is less valuable than the average of price extremes.
By following this method, the concept of equilibrium is introduced to technical chartists when using Ichimoku.

Source: KumoTrader
When you compare the Tenkan Sen to the simple moving average with the same periodicity, the Tenkan Sen shows the midpoints and flattens often, which represents non-trending price action during the previous 9 periods.
The Tenkan Sen can act as support and resistance too as you can see. While the price action breaks below the simple moving average, creating false triggers, the Tenkan Sen displays better support levels.
To spot momentum, you can examine the angle of ascent or descent.
A sharp angle of ascent signals strong momentum to the upside while a steep angle of descent displays strong momentum to the downside.
How accurate is the Tenkan Sen?
Well, because it is a shorter time period indicator, it tends to be less accurate than the Kijun Sen, which features 26 periods.
But it does provide a first glimpse that a trend may be on the verge of changing.
Kijun Sen
Similar to the Tenkan Sen, the Kijun Sen is a measure of the average of the highest high and lowest low prices, albeit over a longer timer period: 26 versus 9.
It is generally regarded as being more accurate because of the longer time span.
To figure out which way the trend is moving, simply look to the direction of the Kijun Sen.
When the price rises above the last highest high or falls below the last lowest low, the Kijun Sen will move up or down respectively to signal a bullish or bearish trend.
It can also act as a level of support on the downside and resistance on the upside.
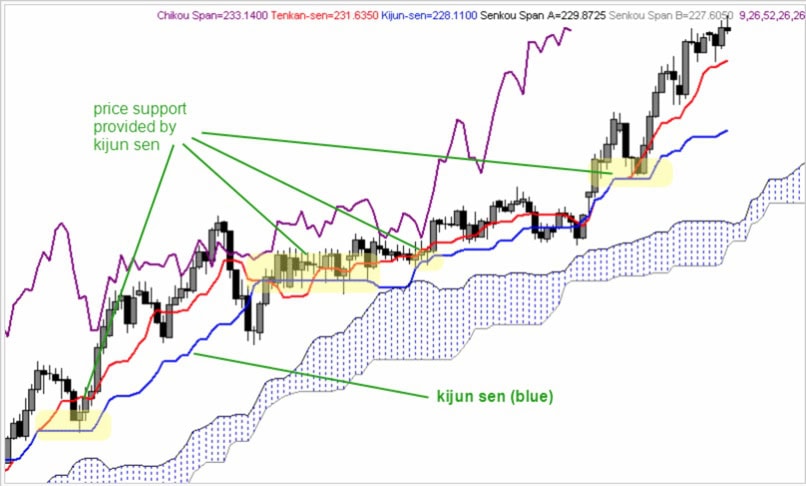
Source: KumoTrader
Some traders view the Kijun Sen as being like a magnet so when the price rises above or below the line rapidly, the price is often attracted back to the line.
To make buy and sell decisions, traders look to Kijun Sen as a gauge.
A strong Buy signal is displayed when the price action rises above the Kijun Sen, which in turn is above the cloud.
Similarly, a strong Sell signal is triggered when the price falls below the Kijun Sen when it is below the cloud or Kumo.
Chikou Span
The Chikou span seems confusing at first because the current closing price is shifted back 26 periods!
Why on earth would Mr. Ichimoku do such a thing?
The answer is it allows you to quickly visualize how current price action compares to price action 26 periods ago.
By so doing, you can more quickly see the current trend.
When the current price is higher than the price in the past, the trend is expected to continue bullish.
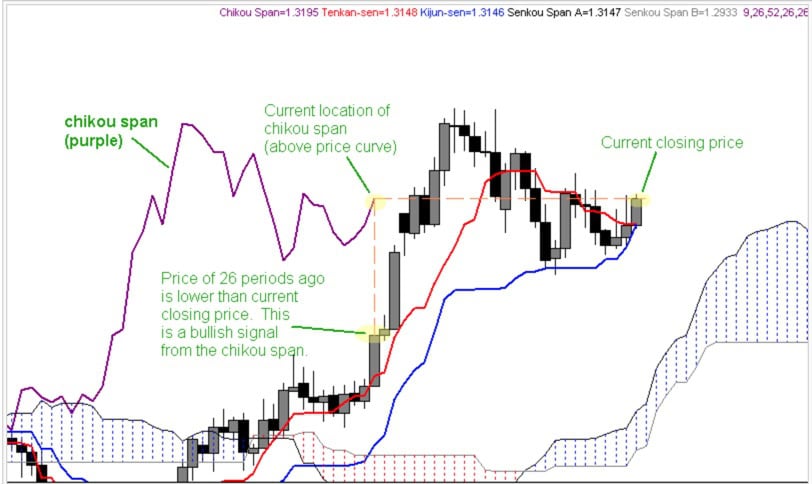
Conversely, a current price below the price 26 periods ago would signify that bearish price action is likely expected.
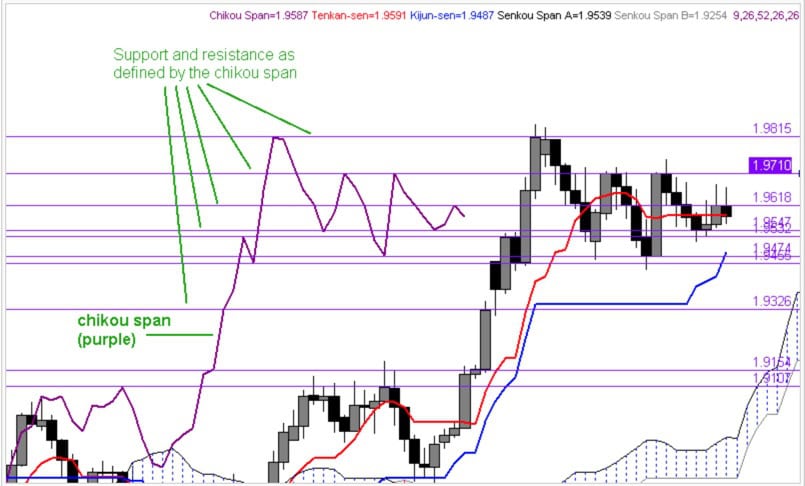
The Chikou Span also provides levels of support and resistance.
Ichimoku Cloud System At A Glance
Buy and sell signals are generated as follows when using the Ichimoku cloud system:
| Buy Signal |
|
| Sell Signal |
|
Ichimoku Cloud: The Bottom Line
The Ichimoku cloud technical analysis indicator produces clear buy and sell signals to chartists.
You first need to get past some of the lingo, like Tenkan Sen and Kijun Sen. But once you do, the entry and exit points are clear.
Buy signals are generated when prices rise above the cloud, the cloud turns green, prices rise above the 26-period Kijun Sen, or the shorter term Tenkan Sen line rises above the Kijun Sen.
Conversely, sell signals are generated when prices fall below the cloud, the cloud turns red, prices fall below the 26-period Kijun Sen, or the Tenkan Sen line falls below the Kijun Sen.
Top brokers like tastyworks provide Ichimoku clouds on charting packages so you can find this technical indicator easily.

The author has no position in any of the stocks mentioned. Financhill has a disclosure policy. This post may contain affiliate links or links from our sponsors.