Support and resistance levels are crucial to know. A support level is a relative low that the price has hit and recovered from to advance again, due to a surplus of buying over selling. Price support acts as a floor, until (and if) the stock breaks down below it. A resistance level is a relative high that the price has hit and pulled back from due to more selling than buying. That is, support and resistance are price points at which buying or selling is insufficient to continue the existing trend. Price resistance acts as a ceiling, until (and if) the stock breaks through it.
Here are some very important rules for support and resistance levels:
- The more times the price has hit (tested) a support or resistance level, the stronger it is.
- The longer it took for the test, generally the stronger the level can be deemed. Some tests of support or resistance are very slender – an intraday touch of the level, for example – and are far less reliable.
- The higher the volume at that level, the stronger the level is, and vice-versa.
When looking at a chart, mentally note or use annotation tools to draw a line under the closest two support levels and the closest resistance level, noting their strength and the number of times it has held. Where there have been repetitive tests of the level and volume diminishes each time, it suggests that the level will be broken.
Most technicians draw the support and resistance lines at the lowest and highest price points, although some prefer to draw them at the lowest (support) and highest (resistance) closes, since the closing price is always more significant. If price reached a certain support or resistance multiple times, you can safely disregard a single price spike above or below the otherwise even line of support or resistance.
The call writer cares greatly where support and resistance are. We have confidence in writing an otherwise qualifying stock after it has conclusively tested support. By the same token, we should avoid placing buy-writes on stocks that are testing or soon to test resistance, since we logically expect them to fail again at resistance.
When price breaks through a resistance level, it effectively transforms that resistance level into a new support level. The same thing happens when price breaks a support level, which then becomes a new resistance level.
Capital Federal (CFFN)
The CFFN chart at Figure 7.10 reflects a stock that came out of a trading range with two incredibly wide-ranging days to make a high at $38. The stock then settled down into what appears to be a new trading range. For the covered call writer, note that there are three nearby support levels. The lower support is 33.61 and more recent support is at approximately 34.50. There is even higher support at 35.22, a former resistance level now converted to support.
Of the three, the middle support level is much stronger, since price held there over a period of seven trading days. The current price on this chart is 35.67, so the closest support level is about 0.45 below the current price. There is also support at the $32.00 and $30.65 levels, which are former resistance levels when the stock was trading in its range before the recent advance.
Figure 7.10 – Chart showing transformation of support and resistance levels, CFFN
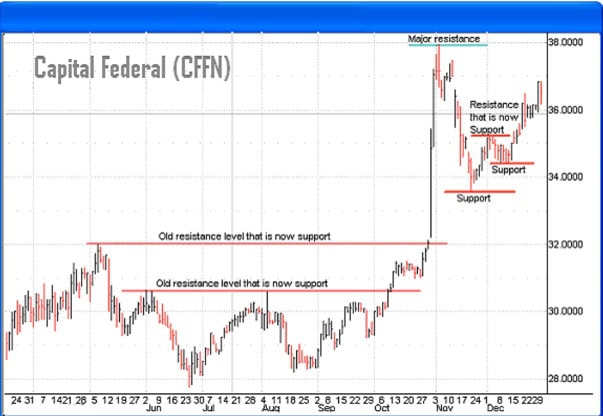
The May-October trading range was fairly even, but price only touched the real range bottom (about $28.25) twice. By the time we could conclude that the stock had gone into a range, in August, it soon began a new uptrend, continuing the uptrend that was in place when the range began in May. For this reason, hindsight is always 20/20 in chart reading, but assessing the stock’s direction is not always possible. This chart and the ones preceding also make the point eloquently that no stock ranges forever; and if oftimes happens that by the time we can be certain a stock is ranging and determine the top and bottom, the range may be ending.
Cirrus Logic (CRUS)
The CRUS chart at Figure 7.11 shows numerous support and resistance levels as the stock rises, including numerous transformations of resistance into support. Each of Points A, B, C, D and E originally were resistance levels that were broken by price advances and transformed into support levels.
Note how each resistance level broken becomes a new support level as the stock continues up. The same thing happens on a downtrending stock: support levels broken through become resistance.
While it is true that stocks have no memory of price (or anything else), they are traded by humans who do have memory. Thus as a falling stock nears a major support level, many traders and perhaps investors may be heartened to get in, and shorts to cover their positions. As a stock approaches major resistance, another failure at that resistance level is caused in no small part by traders taking profit on the assumption it will fail there. After all, if a breakthrough occurs, they can always get back in.
I suspect that if only one human on earth had discovered charting, it would not work nearly as well as it does. The very facts that millions are seeing the same chart and know the same charting rules give life to technical analysis.
Figure 7.11 Chart showing resistance stair-steps, CRUS


The author has no position in any of the stocks mentioned. Financhill has a disclosure policy. This post may contain affiliate links or links from our sponsors.
